
Surface meteorological analyses serve a wide range of research and applications, including forcing inputs for hydrological and ecological modeling, climate analysis, and resource and emergency management. The ability to quantify uncertainty in such analyses further supports their use in probabilistic hydrologic prediction and climate risk estimation applications.
We expanded the spatial regression capability within the Gridded Ensemble Meteorological Tool (GMET) by including daily surface precipitation and temperature forecasts from the High-Resolution Rapid Refresh (HRRR) numerical weather prediction model as additional predictors. The approach also adds cross-validation to the uncertainty estimation component, enabling the use of predictive rather than calibration uncertainty. In evaluation against out-of-sample station observations, the HRRR-based predictors alone are found to be skillful for the study setting, leading to overall improvements in the enhanced GMET meteorological analyses.
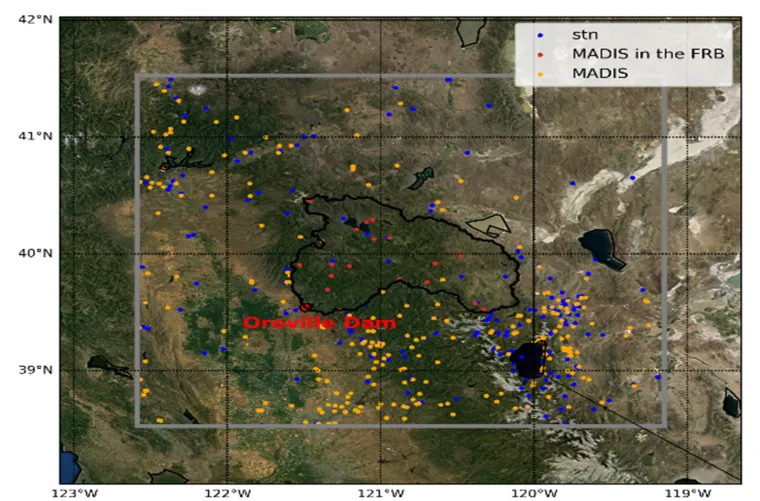
Figure: Study area: Oroville Dam and the Feather River Basin (FRB) watershed (outlined in black). Observations from 172 GHCN stations (blue markers) are used as GMET input. Records from 256 MADIS stations (orange markers) are used for evaluation.
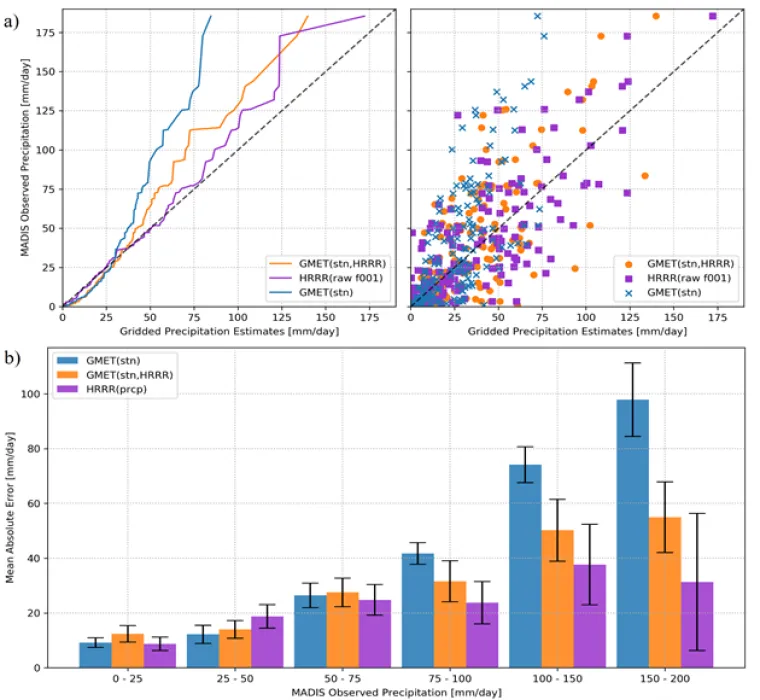
Figure: Panel (a) evaluates precipitation CDFs (left) from stations in the FRB using MADIS observations and shows a pairwise comparison (right) for the precipitation event. 19 stations in the FRB at daily resolution gives an N=171. Panel (b) shows mean absolute errors from the same evaluation stations in the FRB binned by the magnitude of the MADIS observation (for each bin N=84, 35, 24, 13, 12, 2). Error bars show the 95% confidence interval.